Project Overview
This is a copy of the opening sections of the accepted proposal
Objectives and research hypothesis
BRUIT-FM is a multidisciplinary project to identify and exploit the signals hidden within broadband seafloor seismological “noise”. Our goal is to catalogue the different noise sources, understand their contributions to local and global seismological noise and to enhance individual signals by removing others.
According to the Oxford English Dictionary (OED), “noise” is fluctuations or disturbances which are not part of a wanted signal or which interfere with its intelligibility or usefulness. In seismology, ‘noise’ often represents all non-earthquake related signals. In this proposal, we refer to non-earthquake signals as “seismological noise” and use the OED definition when dealing with specific, non-earthquake signals. Marine seismology has made huge technological advances in the past few decades and ocean bottom seismometer (OBS) data is becoming broadly distributed through open data centers using standardised FDSN Web Services. These data can not yet be fully exploited by the seismological community, because of their relatively high seismological noise levels. We propose that this noise, properly understood and treated, is not a hindrance to seismological study but rather a rich source of seismological, oceanographic, environmental, biological and cultural signals, including storms, ocean waves, seafloor currents, ship engines and sonars, marine animals, landslides and icequakes (Figure 1).
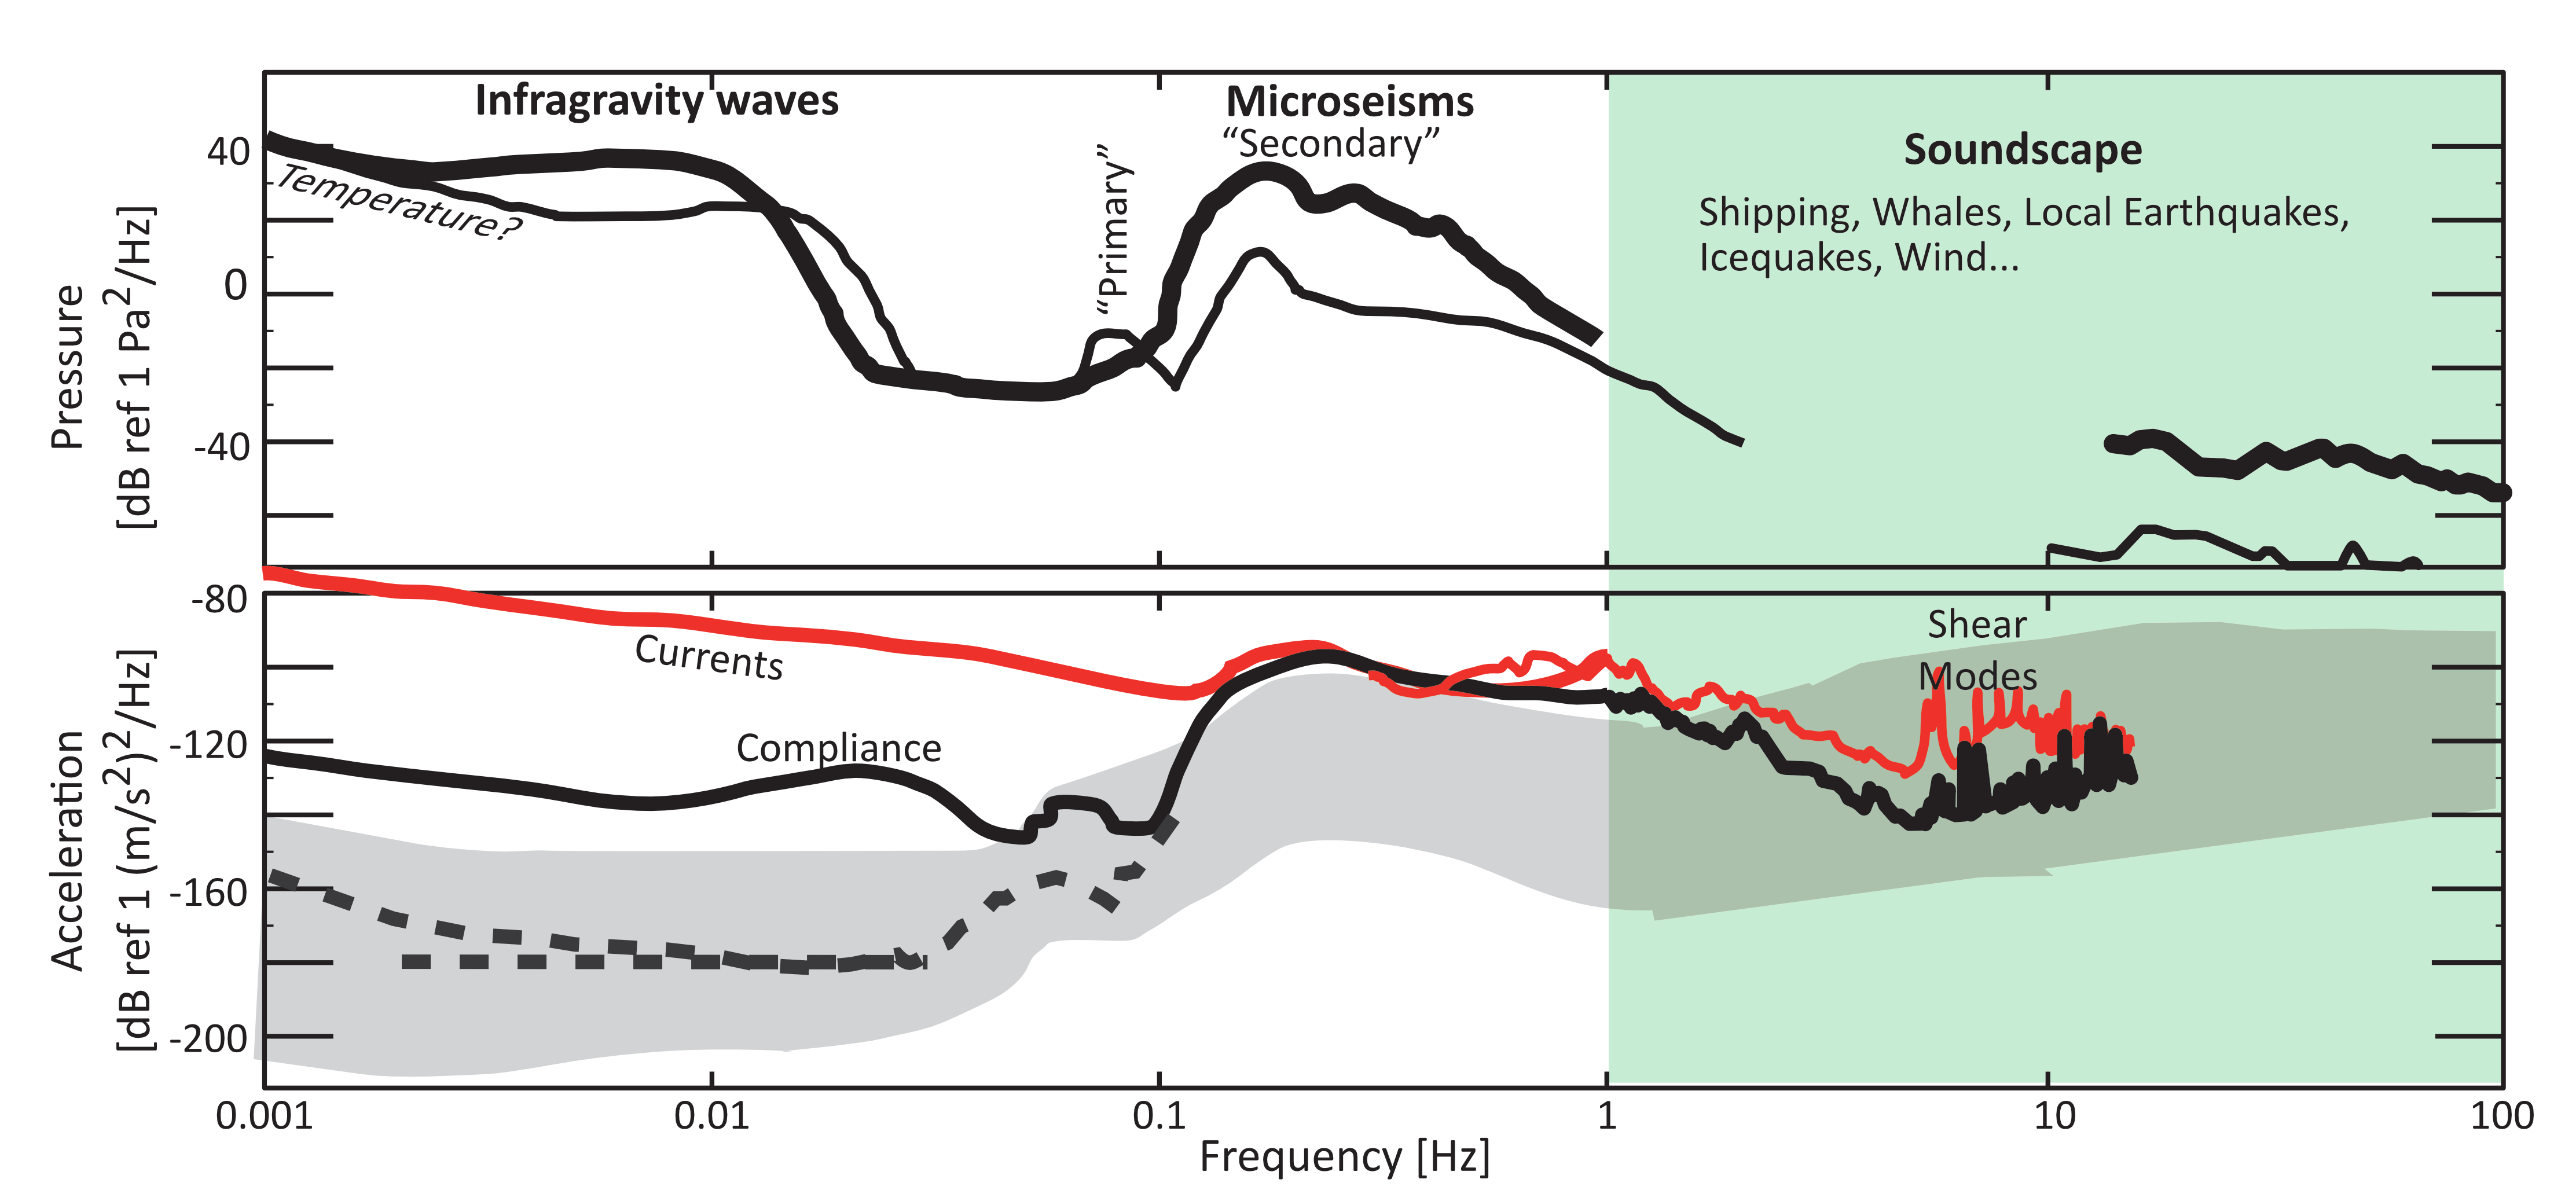
Figure 1: Seafloor seismometer spectra. Green region is the “soundscape” band. Top: Pressure. Thick lines are relaJvely high, thin relaJvely low values. Bottom: Acceleration. Red line = horizontal channels, black lines = vertical. Dashed black line is cleaned spectra [Crawford & Webb, 2000]. Grey background: Global seismometer noise bounds [Peterson et al., 1993; Wolin & McNamara, 2020]. Spectral lines derived from Bradley et al. [1997], Crawford et al. [2006], Webb [1998], McDonald et al. [2008], Hildebrand [2009] and Deen et al. [2017].
Most of our work will be done using autonomous or cabled OBS data. Newer technologies such as DAS can revolutionise ocean bottom sensing by providing dense, real time networks, but they cannot replace the 3D wave-field and deploy-anywhere capabilities of OBSs. Our project will share processing techniques and signal levels with projects using DAS, such as the ANR MONIDAS project, which should be very useful in calibrating their systems.
The work is divided into three parts :
- Global seismic noise, to understand the ocean-induced sources of seismological noise, both at the seafloor and on land; (WP3)
- Signal separation and noise removal at seafloor stations, using our physical understanding of the noise sources and advanced signal processing techniques; (WP4)
- Seafloor soundscape, to characterise seismological, environmental and anthropogenic signals at frequencies > 1Hz, including earthquakes, storms, marine fauna, shipping and icequakes. (WP5)
Understanding and modelling oceanic sources of global seismic noise
Seismic noise at land and on the seafloor is generated primarily by the atmosphere-ocean system, with different mechanisms in the different frequency bands. Each component of the seismic noise field varies over time and space [e.g., Stutzmann et al. 2012]. The low-frequency seismic noise spectrum is separated into secondary microseisms (0.1-0.3 Hz), primary microseisms (0.05-0.1 Hz) and hum (0.003-0.05 Hz). Secondary microseisms are generated by interactions among ocean waves travelling in opposite directions and have double their frequencies. They are recorded worldwide at terrestrial stations but can be recorded in-situ from the ocean floor beneath active storms (Davy et al., 2014, 2015). Primary microseisms are generated by interactions between ocean waves and the seafloor and have the same frequencies as the ocean waves. Seismic hum is created by the interaction of infragravity waves and the sea floor. This low frequency signal is weak but nevertheless large enough to excite Earth’s free oscillations, which can be detected on high quality Broadband OBS (BBOBS) data (Deen et al., 2017).
An integrated understanding of this noise was developed in the framework of the ANR “MIMOSA” project, (2015-2019, PI E. Stutzmann), in which members of the current proposal modelled seismic noise recorded on land in the frequency band 0.005-0.3 Hz, based on ocean waves and several mechanisms (Ardhuin et al., 2015, Farra et al., 2016, Gualtieri et al., 2019, Deen et al., 2017). This model was an important step forward but can still be improved (Meschede et al., 2017). Finally, the amount of Love waves has never been investigated at the ocean bottom and the source mechanism is still debated (Ziane and Hadziioannou, 2019, Sethi., 2019, Gualtieri et al., 2021).
Since the sources of the broadband seismic noise are oceanic, seafloor data are crucial to better characterising and quantifying their distribution and intensity. Seafloor noise has never been quantitatively modelled and we will first need to separate the contribution of distant wave sources from those due to local effects such as currents or infragravity-waves passing above the stations.
We will also study the variability of the noise sources over time and space using the different sensors: seismometers, pressure sensors, rotational sensors, to 1) understand the sources of variations of seafloor noise, 2) propose an integrated model of the sea floor noise and 3) identify the sites and seasons most amenable to seafloor ambient noise experiments. To improve source and site characterisation, we will use machine-learning algorithms to classify signals recorded at each site.
Seafloor seismological signal separation and noise removal
An OBS recording is the superposition of a broad spectrum of signals created by solid earth, ocean wave, biologic and anthropogenic sources. These signals can be very different in amplitude, duration and frequency content but they also can overlap, making them hard to isolate from each other. For instance, infragravity ocean waves in the frequency bandwidth 0.003-0.03 Hz can be used to study subsurface structure (Crawford et al., 2002), but they mask seismological signals in this same frequency band (Webb, 1998; Webb & Crawford, 1999). Similarly, whale calls can interfere with seismological signals at ~20 Hz and seafloor currents generate noise across the measurable frequency band (Duennebier & Sutton, 1995; Crawford & Webb, 2002; Li et al., 2020).
Methods developed to isolate seafloor seismological signals have already been used to enhance earthquake studies and reveal earth’s background free oscillations (Crawford et al., 2006; Ball, et al. 2014; Deen et al., 2017). Better measuring and separating these signals are crucial for seismological studies, for understanding the generation of global noise and for quantitatively characterising the oceanic soundscape.
We propose to improve the state of the art in separating signals present in OBS records using a multi- sensor and multicomponent approach using advanced signal processing techniques. Previous approaches developed for improving seismological signals on the vertical channel used the fact that seafloor current and compliance signals predominate on another channel (horizontal and pressure component, respectively). We will go further in the exploitation of this multi-sensor capacity of OBS instruments.
First, we will improve multi-sensor capacity by physically incorporating a new sensor in the instrument: a rotational seismometer, enabling us both to better measure the rotation signal generated by bottom currents and to investigate separating seismic signals, for example Love waves. iXBlue, a world leader in navigation, positioning and imaging systems, has developed a high-resolution rotational seismometer that can be integrated into the INSU-IPGP BBOBS. It has the best combination of size/ sensitivity/power currently possible for a BBOBS, with 4-5 nrad/s/sqrt(Hz) sensitivity from 0.001-200 Hz and 3W power consumption. Its noise floor level, when converted to horizontal noise levels (Figure 2) is at or below that of seafloor sites at all relevant periods and below that of buried sites for periods greater than 80s. We will install a blueSeis-1C on the gimbaling system of a broadband (Trillium T240) seismometer from the INSU-IPGP national OBS facility. We will conduct laboratory and shallow water evaluations, then we will deploy the system on the ocean floor for one month, to investigate improvements in seafloor data.
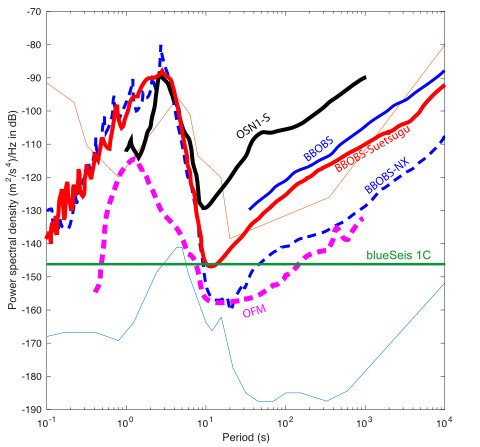
Figure 2: Horizontal component noise levels observed at and beneath the seafloor, compared to blueSeis 1C self- noise level (green). Dashed lines are buried stations. The near-constant slope above ~10 s is caused by tilting due to seafloor currents. Sources: Crawford et al. [2006]; Beauduin & Montagner [1996]; Sutton & Barstow [1990]; Shiobara et al. [2013]; Suetsugu & Shiobara [2014].
Second, we will improve signal processing techniques used to enhance the quality of seismological signals. We will start by revising the reference, transfer function, technique by applying: 1) more critical data window selection based on improved attributes (e.g., Schimmel and Paulssen (1997), Schimmel et al. (2011)); 2) more critical solution selection using a priori forms of the transfer function based on physical models; 3) improvements to the conventional transfer function using analytic signal theory.
We will also adapt non-linear adaptive subtraction techniques developed for active seismic multiple removal, which overcome some of the limitations of the linear transfer function approach (Ventosa et al. 2012, Pham et al. 2014). Finally, we will test other source separation techniques, including component rotation, machine learning, broad source separation methods relying on very-limited modelling assumptions (e.g. Ning et al., 2014) and methods recently developed for the Mars InSight project [Garcia et al., 2020; Kenda et al., 2020]. We will compare the efficiency and effectiveness of the different approaches, analyse the differences and create open-source software using the most effective approach(es).
The seafloor soundscape
The seafloor high frequency band (above 1 Hz) is rich in signals from earthquakes and ocean waves, but also from biological, human and environmental activities. Acoustic waves travel efficiently through the water column but are challenging to separate into their biophony, geophony and anthropophony components, particularly in a world dominated by the continuous local and global ocean wave dynamics. OBSs can provide important data concerning environmental, economic and societal issues if we can understand and decipher the origin of these signals.
 :
:
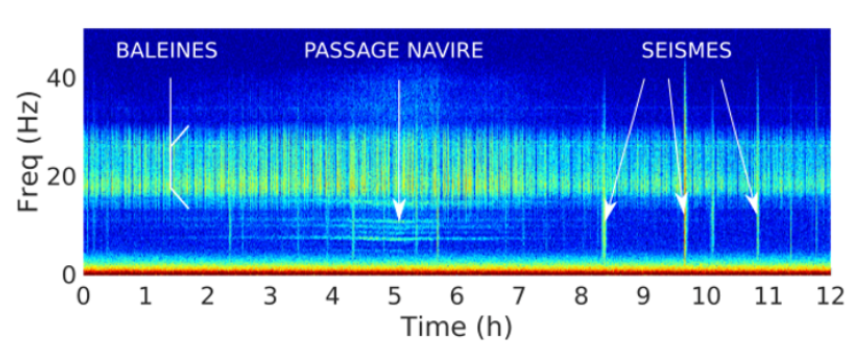
Figure 3: Seismo-acoustic soundscape recorded by an OBS from the RHUM-RUM experiment in the Indian Ocean, showing close cohabitation of earthquake (“SEISMES”), ship (“NAVIRE”) and whale (“BALEINE”) signals
Using available data from recent OBS deployments, we aim to better understand and constrain noise sources recorded on the seafloor and to create synergetic links between disciplines such as ecology, bioacoustics and seismology. To promote and facilitate this synergy, BRUIT-FM proposes to catalog available data from the various oceans and to quantify the ambient sound levels and seismological noise components as well as their regional and seasonal variations. Typical sound signatures will then be investigated to better constrain their origins. We propose to then analyse in greater detail some ubiquitous sound sources: whales, ships and ice.
One under-exploited application of OBS data is monitoring submarine fauna that emit sounds and calls in the recording band of OBS seismometers and hydrophones. OBSs can detect several baleen whale species emitting calls in the 1-100 Hz band, which allowed us to quantify their seasonal distribution in the western Indian Ocean (Bouffaut et al., 2018) and to track them over parts of the OBS network where inter-station distances were small enough (i.e. <50km) (Dreo et al., 2019). The large number of OBS data available for this application is a real opportunity to develop and respond to scientific questions concerning whale populations, migrations, basin-specific calls and, ultimately, population density. The strong and unique whale call signal may even allow them to be used for crustal imaging (Kuna & Nabelek, 2021).
OBS data can also be used to ground truth ocean sound pollution models. The European Union MSFD « “Marine Strategy Framework Directive” 2008/56/CE requires state members to guarantee and monitor the ecological state of the oceans. Anthropogenic underwater noise is clearly identified as a pollution that needs to be monitored to reduce its impact on marine life. In the 1 to 100 Hz frequency band, anthropogenic noise pollution comes from marine traffic, geophysical prospection, military operations and underwater works. Noise modelling is widely used at basin scales in this community, but seafloor measurements using existing datasets will provide precious ground truth (Kinda et al., 2018) at low cost.
OBSs can be used to detect, locate and track moving noise sources. A recent IPGP-DGA thesis (Trabattoni, 2021) demonstrated that ship noise can be used to accurately locate and orient an OBS on the ocean floor using the vessel’s location indicated by its AIS (Automatic Identification System) and that OBSs can detect and locate moving sound sources such as surface vessels and whales, without any a priori information. This development has important economic and societal potential, for example in detecting illegal incursions of AIS-disabled vessels into an EEZ or characterising whale populations and migrations to better understand the impact of anthropogenic noise on them. Real time monitoring will be possible in the very near future using ocean floor cables, but we must first identify and understand the various noise sources in order to correctly develop these systems.
Finally, OBSs may also record cryoseismic activity emitted from polar events, even at large distances. These events occur particularly in the coastal areas of Antarctica, where glacial outlets and ice shelves create huge icebergs that interact with each other and with the ocean bottom, generating monotonic tremors (Müller et al., 2005; Macayeal et al., 2008) that can propagate across ocean basins. Detecting and characterising cryoseismic events at the ocean bottom may provide a new way to monitor polar ice discharge.
Position of the project as it relates to the state of art
State of the art in understanding seafloor and terrestrial noise
Some mechanisms for the generation of microseisms and infragravity waves have been known for decades (Longuet-Higgins, 1950, Hasselmann, 1963), but an integrated understanding of the noise in the broadband frequency range 0.002-0.3 Hz was only recently developed, in the framework of the ANR “MIMOSA” project (2015-2019) and based on different mechanisms involving ocean waves. This model reproduces only half of the observed sources in the secondary microseism frequency band (Meschede et al., 2017) and can be improved. One important unknown parameter is the amount of ocean waves reflected at the coast. Seafloor seismic noise has never been similarly modelled and OBS data will enable us to improve the global source model
Love waves also exist across the ambient seismic spectrum but their generation mechanism is still debated. They cannot be directly generated by oceanic sources, so a conversion mechanism must be found. Possibilities include crustal heterogeneities (Ziane and Hadziioannou, 2019), slope discontinuities (Sethi, 2019) and 3D structure (Gualtieri et al., 2021). The use of ocean bottom seismometers, pressure sensors and rotational sensors will enable us to investigate and quantify the amount of Love waves. This would be of particular interest in the vicinity of a cyclone for understanding the generation mechanism.
An accurate model of broadband sources may also significantly improve the resolution obtainable using “ambient noise” seismology, by allowing the calculation of finite-frequency noise correlation sensitivity kernels (Tromp et al., 2010).
State of the art in removing seafloor noise
Seafloor noise is presently removed from seafloor vertical seismometer data using transfer function techniques, noise-minimising component rotation, instrument shielding and sensor burial. The transfer function and component rotation techniques (Ball et al., 2014, Bell et al., 2015), now available as Open Source software (https://nfsi-canada.github.io/OBStools/atacr.html ), are small improvements on techniques developed by Crawford & Webb (2000). Burial can reduce horizontal noise by up to 30 dB (Beaudoin & Montagner, 1996; Crawford et al., 2006; Shiobara et al., 2013), but is time-consuming and expensive. Shielding may also reduce noise levels (Janiszewski et al., 2020), but makes for more cumbersome instruments and thus has been limited to smaller wide-band sensors. Relevant seismological noise reduction methods have also recently been developed for the Mars InSight mission (Garcia et al., 2020; Kenda et al., 2020).
Pillet et al. (2009) suggested that a sensitive tiltmeter or horizontal seismometer could be used to greatly improve low-frequency horizontal data. Lindner et al (2017) showed that rotational information from a fiber optic gyroscope could be used to reduce horizontal noise levels at a shallow North Sea site, but the site was much noisier than the seafloor norm, the rotational sensor consumed too much to be practical energy (28 W, compared to < 1W for a BBOBS) and the gyroscope’s sensitivity was only adequate for very noisy sites. The recent technological developments in rotational seismology provide unique opportunities for progressing in this direction.
State of the art in categorising soundscape noise
The high-frequency side of the ocean bottom seismic spectrum (1-100Hz) corresponds to the ultra-low frequency (ULF) band of hydro-acoustics. This domain is generally studied using hydrophones, which can sample the signal at high rates but provide only a scalar value of the local pressure, requiring instrument networks to locate and track sources. The seismometer and hydrophone of a single OBS provide a 4- component vectorial measurement of the full medium displacement and, therefore, the possibility of analysing the polarisation of the acoustic/seismic waves, opening new ways to detect, locate and track sources. This seismology/hydroacoustics overlap in the 1-100 Hz frequency band provides a unique opportunity to create links between communities working in the biophony and anthropophony domains. Sub-seafloor imaging using whale calls (e.g., Kuna and Nabelek, 2021) is an example of new perspectives arising from multidisciplinary study of the full OBS spectrum.
Baleen whales are usually detected by hydrophones moored for military or hydro-acoustic purposes (Mellinger et al. 2007). In the deep ocean, hydrophone are usually positioned in the SOFAR channel, at 1000-1500 m depth (e.g., Fox et al., 2001; Samaran et al., 2013; Leroy et al., 2016, 2018; Tsang-Hin- Sun et al., 2015) requiring moorings that are complex to deploy and maintain. Moreover, hydrophone networks are often deployed in a sparse array limiting the possibility of locating and tracking whales. OBSs can be used to detect and track whales from the ocean bottom (e.g., Dunn and Hernandez 2009; Wilcock, 2012; Harris et al., 2018). We will investigate the benefits and limitations of 4-component OBS data for tracking whales and other animals (Bouffaut et al., 2018; Dréo et al., 2019), to open bridges to the bio-acoustic community and to better exploit the masses of existing ocean-bottom data.
Ships have been detected from OBSs at distances up to 100 km and have been tracked by isolated 4- component OBSs (Trabattoni et al., 2020). We will further explore the use of ship noise for sub- seafloor imaging, as proposed by Trabattoni (2021). Noise pollution levels in the Indian Ocean were studied by the French Naval Hydrographic and Oceanographic Service (SHOM) using data from the RHUM-RUM experiment (Kinda et al., 2018). We will extend this collaboration to other ocean basins.
Ice-induced signals are clearly recorded at large distances by hydrophones moored in the SOFAR channel (e.g., Royer et al., 2015) and as T-waves on terrestrial island stations (Talandier et al., 2002). They are probably recorded by OBSs at large distances but this is poorly documented. We propose to combine cryoseismic signal analysis at distant OBSs with near-field data from a rare OBS deployment in Antarctic coastal areas( IPEV-funded SEIS-ADELICE project, PI G. Barruol). This deployment in front of the floating tongue of the Astrolabe glacier will record signals from glacier crevassing and gliding, tide and swell, icebergs and sea-ice dynamics and from the bio-acoustic landscape of this coastal area, providing a near field baseline for what is recorded in the far field.
Methodology and risk management
The project is divided into 5 Work Packages (WPs). WP1 coordinates and manages the project, WP2 handles common data and signals between the primary scientific packages, and WPs 3, 4 and 5 are the primary scientific packages. Most of the data are publicly available on FDSN-compatible data centers and we are active collaborators on the others: the “embargoed” datasets will become publicly available after the embargo period.